
Graph Widget
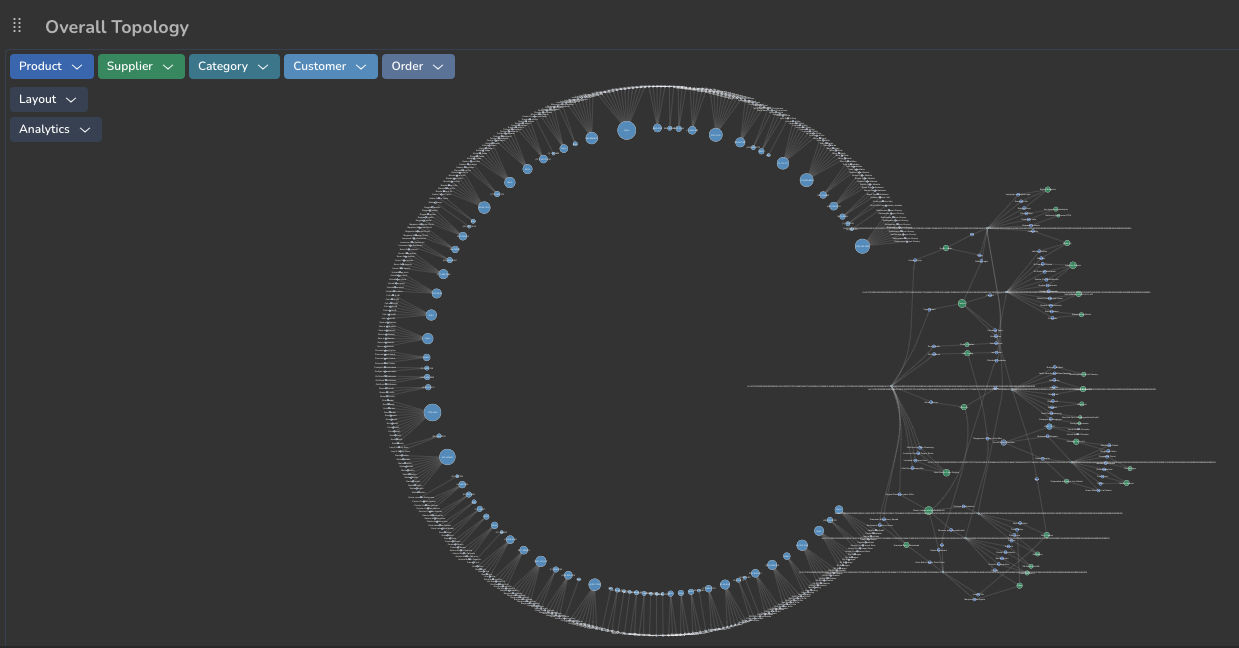
The graph widget encapsulates graph visualization driven by a graph database.
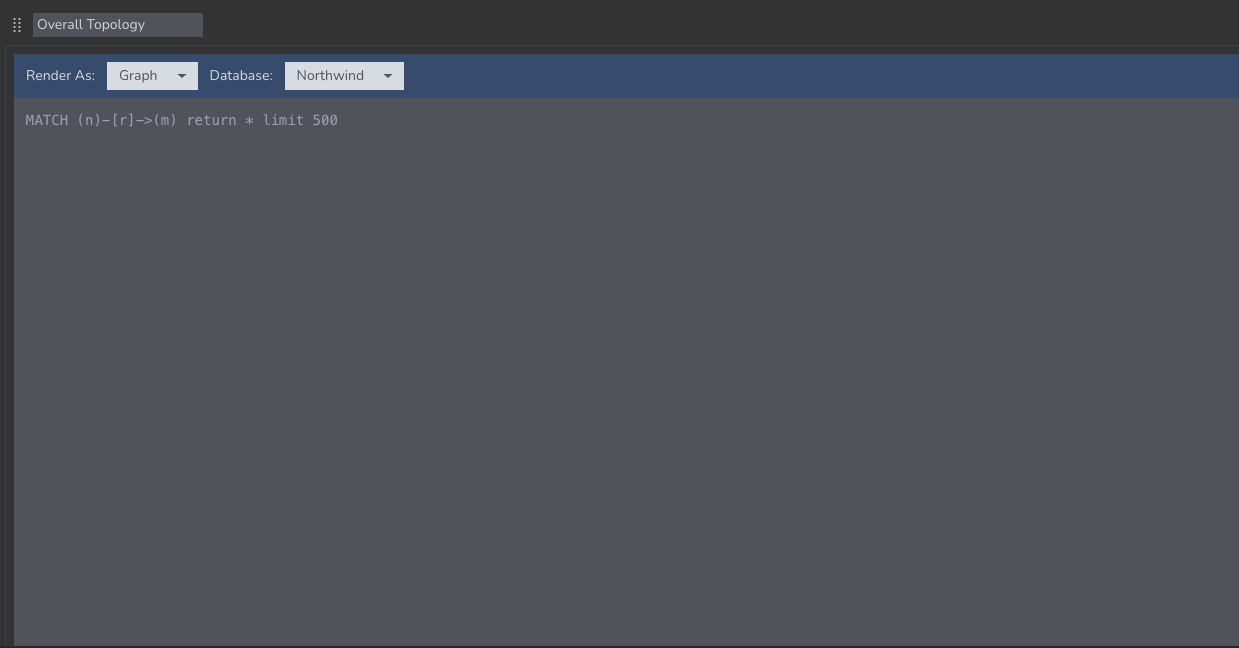
How to use
- add a graph widget to a dashboard
- select the 'Graph' option as render option
- select the graph database
- write a (Cypher) query to retrieve the data
Since a graph needs nodes and edges the query should return them. If the query returns e.g. only numbers or strings the graph widget will not be able to render anything. The typical query will look like this:
MATCH (n)-[r]->(m) return * limit 500Every node type has a set of properties and by default the rendered label will be the first property. You can select for each node type which property should be used as label.
Centrality and analytics
Depending on the underlying graph visualization library you can access various analytics and centrality measures. For example, with yFiles you can access the following:
- Degree: The degree of a node is the number of edges connected to it. The degree centrality of a node is the number of edges connected to it.
- Closeness: The closeness centrality of a node is the average length of the shortest path between the node and all other nodes in the graph.
- Betweenness: The betweenness centrality of a node is the number of shortest paths that pass through the
- Eigenvector: The eigenvector centrality of a node is the sum of the centrality scores of its neighbors. This means that a node is important if it is connected to other important nodes.
- PageRank: The PageRank of a node is the probability that a random walk will visit the node. This means that a node is important if it is connected to other important nodes.
and much more. See the amazing yFiles documentation for more details.
The (much more) basic Cytoscape library also supports various analytics:
- Degree: The degree of a node is the number of edges connected to it. The degree centrality of a node is the number of edges connected to it.
- Closeness: The closeness centrality of a node is the average length of the shortest path between the node and all other nodes in the graph.
- Betweenness: The betweenness centrality of a node is the number of shortest paths that pass through the
- PageRank: The PageRank of a node is the probability that a random walk will visit the node. This means that a node is important if it is connected to other important nodes.
Layout
The graph widget supports various layouts. The layout is the way the nodes and edges are arranged on the screen. The set of supported layouts depends on the underlying graph visualization library. The yFiles library boasts a staggering amount of layout algorithms while the Cytoscape package has a limited set.